
My partner and I have been homeowners for over a year now, and it has been great. However, the time has now come for us to start seriously thinking about some mid-term and long-term renovations that we always knew would have to happen eventually. So we sat down, made a list of renovations along with target years and projected costs, and then wondered how much we need to save each week in order to make all these goals achievable without relying on loans.
DISCLAIMER: This is a write-up describing a personal programming project, and does NOT constitute financial advice.
The problem is more complicated than it sounds at first. It is not a matter of merely summing up the costs of all projects and dividing the total between a number of weeks, as different expenses will occur at different points in time. And then there is also the fact that our capacity to set money aside increases every year.
First, here is some context on how I approached this problem:
- I am a former software developer turned computer science teacher. I teach at a level between high school and university specific to the Canadian province of Québec.
- This semester, I teach an introductory Python programming class targeted at students who will go on to pursue university studies in various scientific fields. The class includes the use of NumPy and matplotlib, so these tools were already on my mind.
- I am currently watching Numb3rs, a crime drama from 2005 about a mathematician who helps the FBI solve crimes using math, which makes me want to write big scary equations on a chalkboard and pretend that I am a mathematical prodigy.

I originally defined the problem using the following variables:
- : the time in years, starting at current year.
- : the total amount set aside depending on .
- : the yearly increase rate of how much we can save each week.
- : the projected interest rate on our savings.
- : the projected cost of each renovation to fund.
- : the target year for each renovation.
- : how much money we need to save in the first year.
Here, is the unknown variable. My goal was to find the minimum value it needed to have in order to reach amounts at times while taking into account that spending an amount at a time reduces the money available from that point in time. At first, I thought this was a linear algebra problem. Turns out it isn't (so long for the mathematical prodigy!), and is basically just a series of equations put back to back.
So, during a bus ride to work, I used one of the models available through Duck AI to brainstorm on how to solve this using NumPy. Once I was back in front of my computer that evening, I copied the code into VS Code, ran it, tweaked a few things, and got a number. And this was when the journey actually began.
Before going any further, I want to specify that although I am usually an enthusiastic sharer of code, I will not share my code this time, as I am unsure of the legal implications of sharing a tool to plan savings (and again, none of this is financial advice).
So, the code gave me a number, which was allegedly the minimum value of that would make it all work. That number turned out to be incorrect, since the AI had forgotten to take into account that the money needed for a project at would then be withdrawn from the available funds! So I fired up opencode and had it change the code iteratively. This was probably the closest thing I had ever done to pure "vibe-coding", even though there isn't a single line of code in that program that I didn't end up editing manually in the end (more on that later). I eventually changed the result displayed by the program from to , as a weekly saving amount is more useful than a yearly total. It was hard to trust that single number though, as it was giving me no information on the big picture. I needed to know what the value of would look like over time. I also wanted to know how the weekly saving amount would need to evolve based on (the yearly increase rate).
Enter matplotlib! Below is an example of the final output of my Python script (with fictional projects and parameters, as I do not wish to share precise details about my actual finances to strangers on the internet).
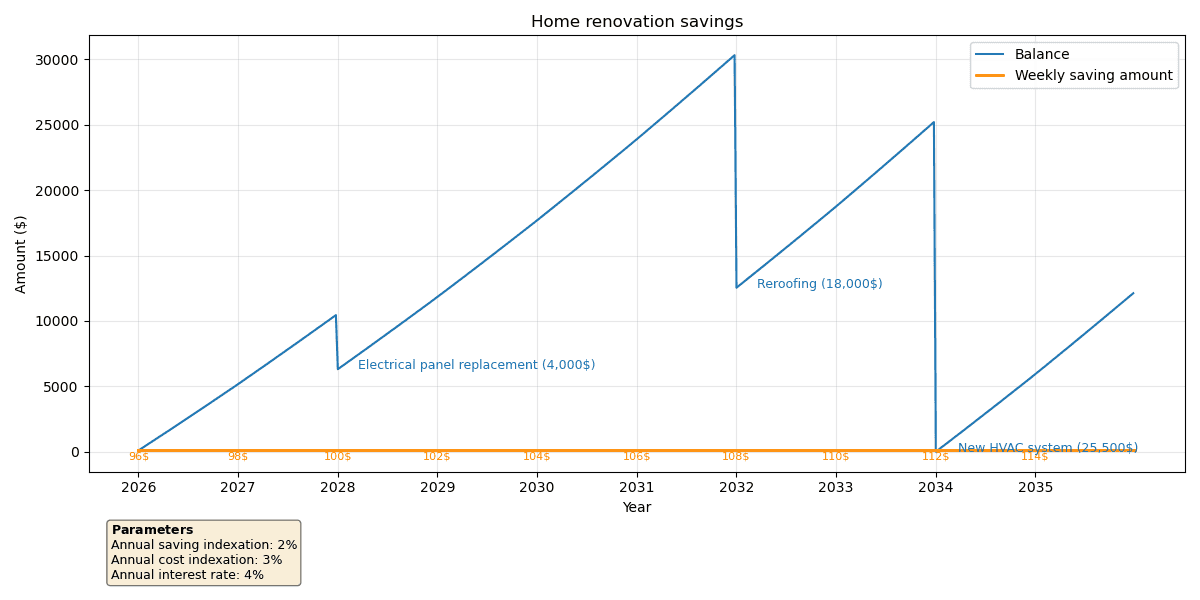
For the sake of simplicity, the graph assumes that every project happens at the beginning of its target year. Notice that I added a parameter to account for inflation (I actually called it "cost indexation" as it might be higher than the general inflation rate). The costs provided in the input are the projected costs in today's money. The ones that appear on the graph are the amounts after the indexation rate has been applied, rounded to the closest 500$ to avoid showing oddly specific numbers for amounts that are essentially based on guesstimates to begin with.
Generating that graph involved a lot of back-and-forth with opencode, and the result finally gave me all the information I needed to actually verify the data. Because no, I do not blindly trust AI-generated code with my money! Nor do I blindly trust human-written code for that matter! So my next step was to fact-check the graph using a spreadsheet.
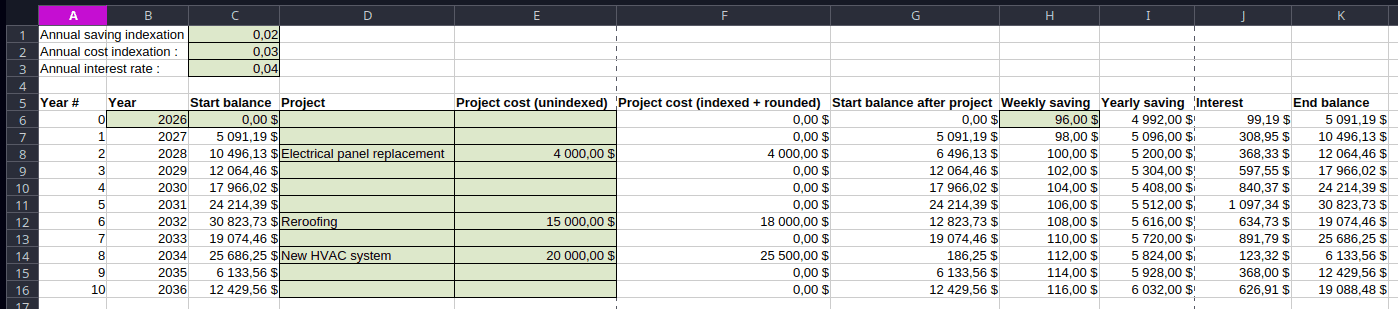
The highlighted cells on the spreadsheet are input, everything else is calculated. Comparing the values between the spreadsheet and the graph for the indexed costs, the weekly savings and the balances gave me trust that my script was working as intended!
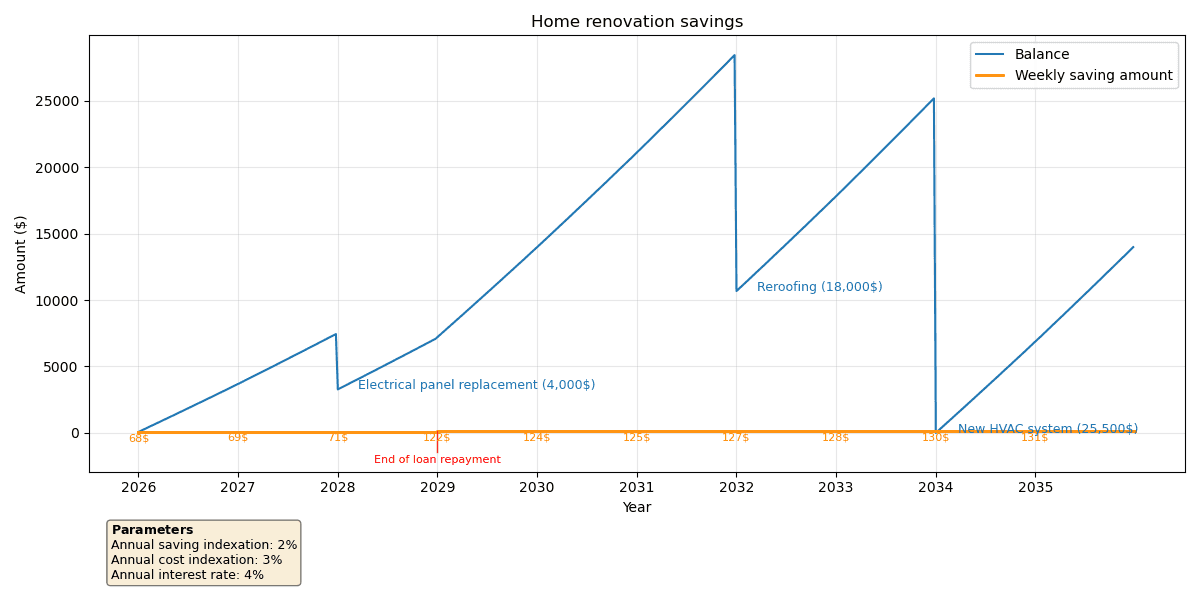
My final addition to my tool was the ability to add one-time increases in weekly savings, which might be useful when more money becomes available after finishing paying off a loan for example. This would of course lower the minimum weekly saving for the first year.
I was now perfectly happy with the graph I was getting. My final step was to go through the code and make sure that I understood all the math. I ended up renaming almost every variable, as the names generated by AI were too often unclear or inconsistent. For this step, I put opencode in "Plan" mode and asked it to explain some variables to me and to tell me if my proposed new names made sense. I also moved the input variables to a separate config.py file, and separated the script into four clearly defined sections:
- Creation of necessary variables
- Calculation of minimum weekly saving at
start_year - Simulation of weekly balance
- Plotting of the results
So that's it! I now have that homebrew tool that was mostly LLM-generated, but with strict validation of the results, while also making sure that I understood the code. The end result is that my partner and I now know exactly what we need to do to prepare for our needed renovation projects in the future. And even if things might not end up going exactly as planned, any level of preparedness is better than waking up 10 years from now with urgent renovations that we could have planned for, but didn't.